Trade Ideas
Assisting traders in identifying optimal market setups at the present moment.
KEY FEATURES
Unique &
actionable insights
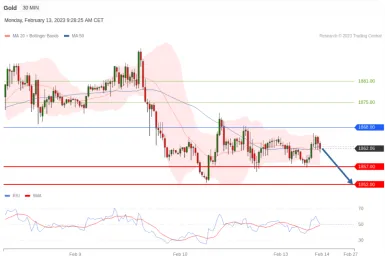
Supporting you with actionable top-down research.
All analyses are identified using the proprietary top-down global-macro model created by an award-winning research team. Partnered with our patented pattern recognition technology, Trade Ideas is constantly scanning the market to provide full position management on over 8,000 instruments.
Engage, Educate & Empower.
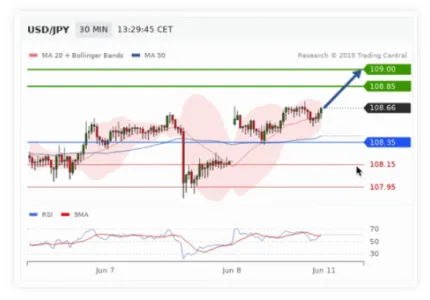
Trade ideas on a trading website engage traders by offering real-time market analysis, educational resources, and interactive tools, fostering a dynamic learning environment. Through these insights, traders are empowered with knowledge, confidence, and strategic guidance, enabling them to make informed decisions and achieve their trading goals.
Professional, independent second opinion
Views from our senior research analysts
The most advanced investing tools
Through a balanced feature set of detailed, proactive analytics, educational guidance and customizable options, Trade Ideas empowers investors of all skill levels to take control of their investments.

Clear Trend Lines
Manage your risk with the clear price targets and pivot line.

Alternative Scenario
The blue stop line marks when a trends has reversed, helping traders manage their risk on an investment.

Simple Lookup
Monitor existing positions or validate a new idea, Trade Ideas easy search feature provides instant access to the most analyses!

Beautiful Charts
Beautiful new, modern charts. You won't just enjoy the analysis, you'll love the experience!
Frequently Asked Questions
Every analysis includes two target prices for the instrument; a consevative target and an ambitious one. These are labeled as our support levels and are represented by the two thick green lines on the chart. If the price reaches one of these lines, the preferred scenario is confirmed.
The commentary on “Supports and Resistances” provides further details on why these levels were selected and the likelihood of them being met. The asterisks indicate the likelihood at a glace with 1 indicating a weak chance, with 3 indicating a high likelihood.
The thin blue line represents our pivot level. The price crossing this threshold indicated that there has been a physiological shift in the market and that our trend has reversed. In this case, our alternative scenario is now in play. Because this pivot level indicates when the preferred scenario has become invalidated, it can be used as a simple stop loss level within your trading to help you manage risk.
Preferred scenario indicates the most likely directional outcome and is illustrated by the blue arrow on the chart.