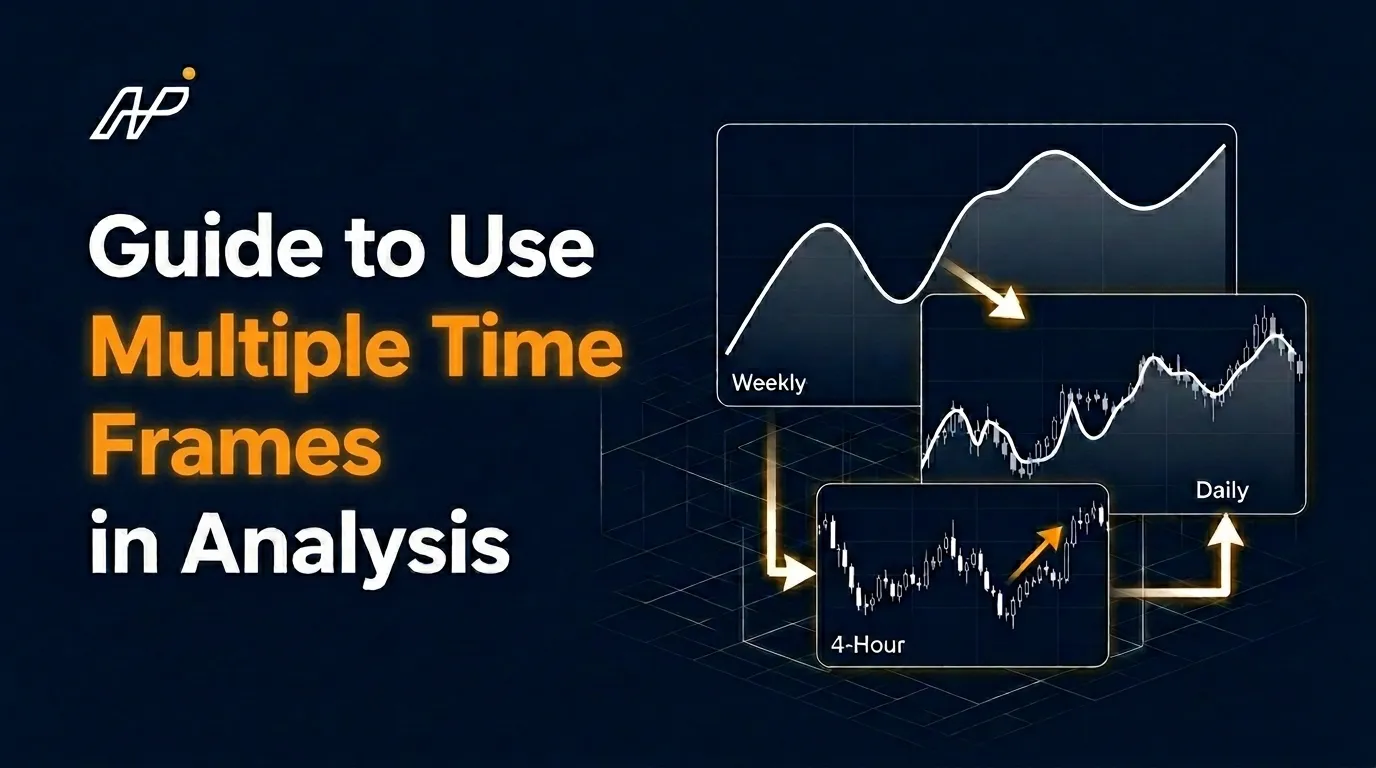
One of the most common mistakes new traders make is looking at only one time frame when making trading decisions. A trade that looks perfect on a 5-minute chart might be going directly against a powerful trend on the daily chart. Multiple time frame analysis solves this problem.
The Principle of Top-Down Analysis
Start with the biggest picture and work your way down to the entry level. This ensures every trade is aligned with the dominant market direction.
High Time Frame (Trend Direction): Use the weekly or daily chart to determine the overall trend direction. Ask: is the market making higher highs and higher lows (uptrend)? Or lower highs and lower lows (downtrend)? Only trade in this direction.
Medium Time Frame (Structure and Zones): Use the 4-hour or 1-hour chart to identify key support and resistance levels, and to see where the price is within the broader trend.
Low Time Frame (Entry Timing): Use the 15-minute or 5-minute chart to time your entry. Wait for a confirming signal at the level identified on the medium time frame.
Trading Example Context
Example: On the daily chart, EUR/USD is in a clear uptrend. On the 4-hour chart, price has pulled back to a key support zone at 1.0850. On the 15-minute chart, a Bullish Engulfing candlestick forms at 1.0852. This is your entry signal — supported by three time frames, with a clear stop below 1.0850 and a target at the prior daily high.
Key Takeaway: Multiple time frame analysis reduces the number of losing trades by ensuring you are never fighting the bigger trend. Always know what the market is doing on the chart one or two levels above your trading time frame.