Guide to Read Support and Resistance Levels on a Chart
Support and resistance levels are the foundation of all price chart analysis. Every other technical tool — indicators, patterns, Fibonacci levels — ultimately works best when used in combination with support and resistance. Understanding these levels is the single most important skill a new trader can develop.
Understanding Support?
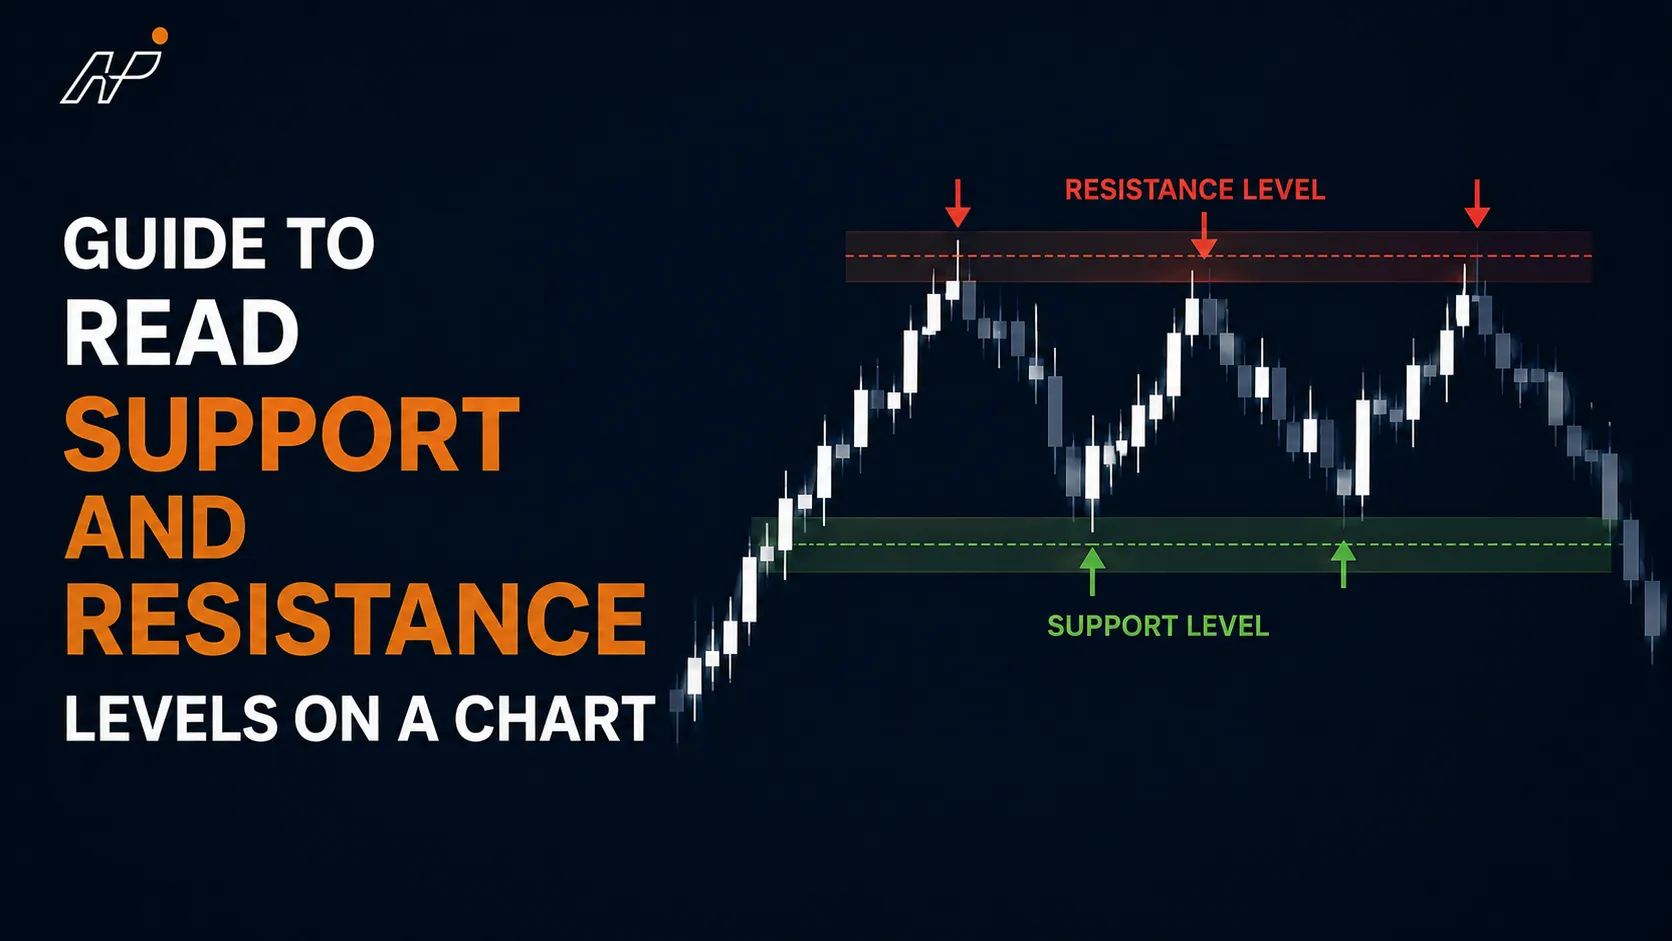
Support is a price level where buyers have historically stepped in, preventing the price from falling further. Think of it as a “floor.” Each time the price falls to this level and bounces back up, it reinforces the floor.
Understanding Resistance?
Resistance is the opposite — a price level where sellers have consistently pushed the price back down. Think of it as a “ceiling.” When price approaches resistance, sellers take their profits and new sellers enter, creating downward pressure.
Types of Support and Resistance:
Horizontal Support/Resistance:
The most common and most powerful. Drawn as flat horizontal lines connecting two or more price highs (resistance) or lows (support). The more times a level has been tested without breaking, the stronger it is.
Dynamic Support/Resistance:
Moving averages (such as the 50-day or 200-day MA) act as dynamic support and resistance because they move with price.
Psychological Levels:
Round numbers such as 1.3000, 2000.00, or 100.00 naturally attract significant buying and selling activity.
Role Reversal:
When a support level is broken convincingly, it often becomes resistance on the way back up — and vice versa. This is one of the most reliable phenomena in chart analysis.
How To Draw Support and Resistance Correctly:
To draw support and resistance correctly: look for areas where price has reversed multiple times. Connect the wicks (not just the bodies) of the candles at those levels. Draw zones rather than exact lines — treat support and resistance as areas a few pips wide. The best zones are those tested three or more times.
Key Takeaway: Support and resistance are the map of the market. Before placing any trade, identify the nearest support and resistance levels — they tell you where the market has been and where it is likely to pause or reverse.