Understanding a Trendline and How Do You Draw One Correctly?
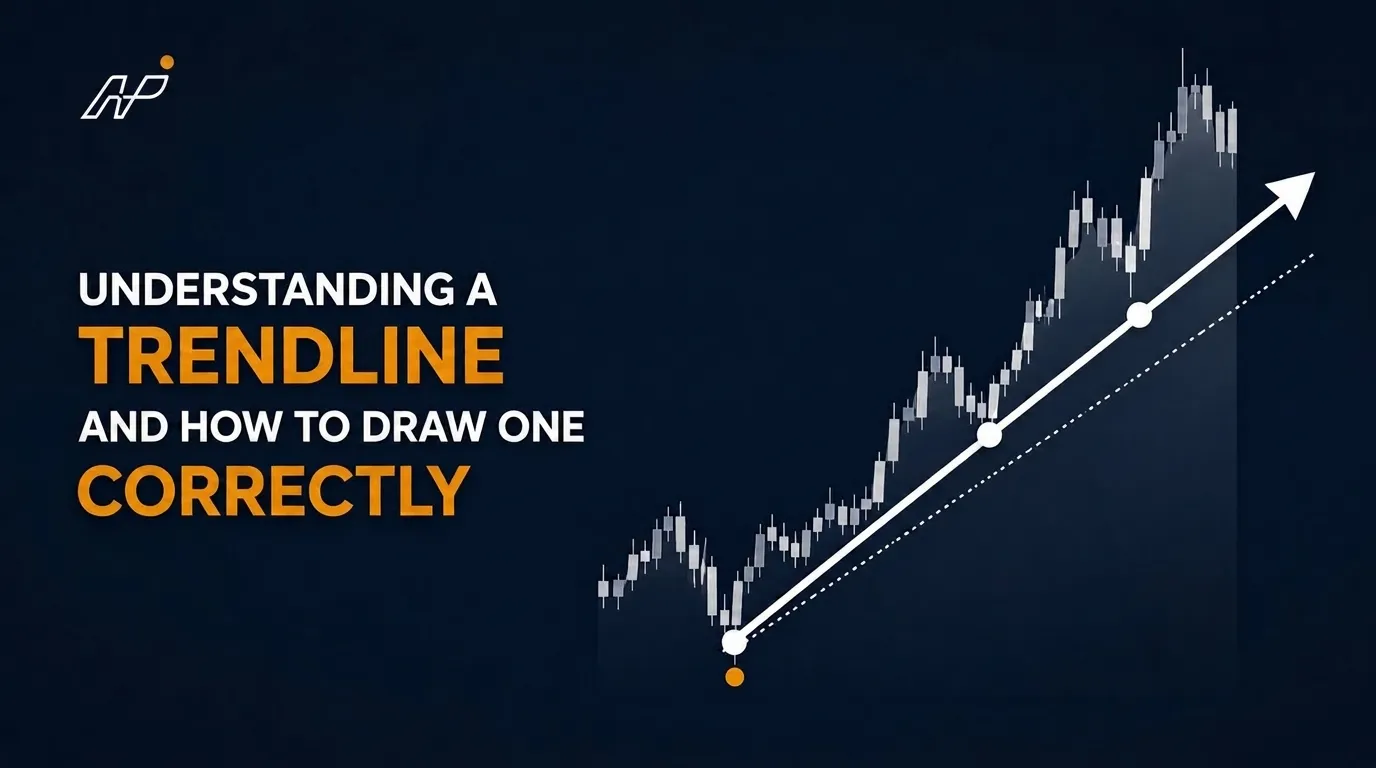
Uptrend Line
Connect at least two successive higher lows on the chart. The line is drawn below the price, sloping upward from left to right. This line acts as dynamic support.Downtrend Line
Connect at least two successive lower highs on the chart. The line is drawn above the price, sloping downward from left to right. This line acts as dynamic resistance.Valid Trendline Rules & Breakouts:
- Valid Trendline — 3 Rules: First, it must connect at least two significant swing points (three is ideal). Second, the line should not cut through the candle bodies — it should touch the wicks. Third, the angle should be natural — a trendline at 45 degrees is more sustainable than one at 80 degrees.
- Trendline Break: A trendline is broken when price closes convincingly on the other side of the line. A “test and reject” is not a break. A real break is confirmed by a candle that closes through the line with volume.
- Fake-out vs. Real Break: Price sometimes pierces a trendline briefly before returning to the trend. To filter fake-outs, wait for a candle to close beyond the trendline, or use a second confirming candle.
- Role Reversal after a Break: Once a trendline is broken, it often reverses its role. A broken uptrend line may become resistance on a subsequent rally — the “retest of the broken trendline” is one of the most reliable setups in technical analysis.
Key Takeaway: Drawing trendlines correctly takes practice, but the payoff is significant. A valid trendline gives you dynamic entry points, a clear invalidation level, and an early warning system for when a trend is ending.