Trend Reversal vs. Trend Continuation
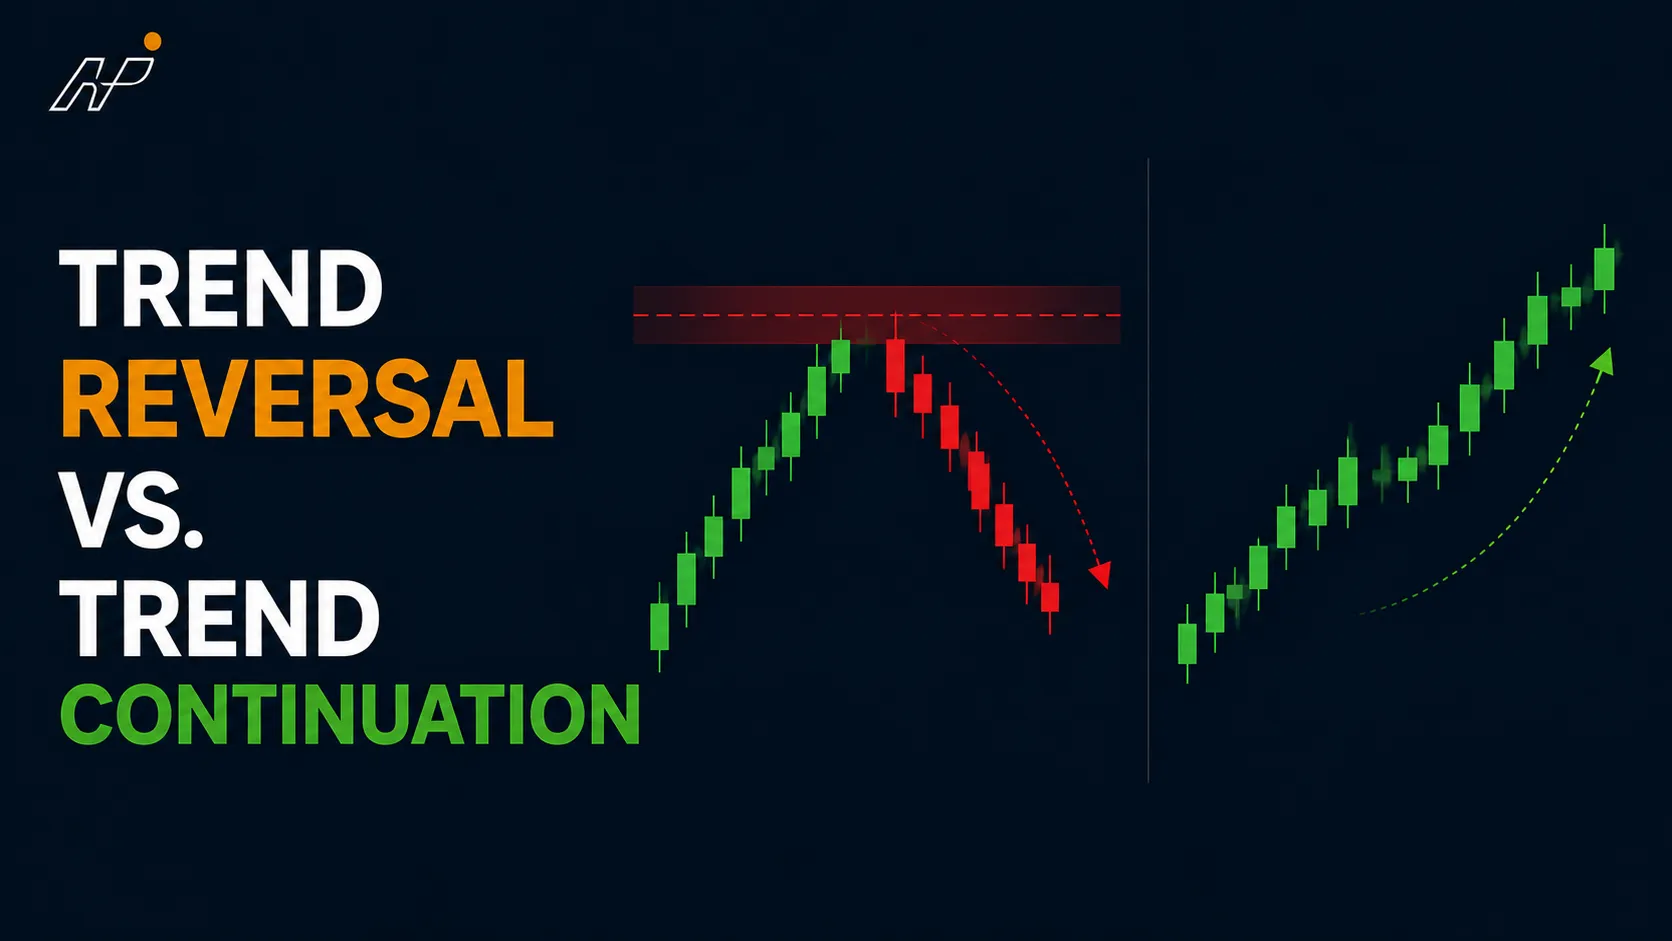
Signs of a Trend Continuation (Pullback):
- Price pulls back to a key level: In a healthy uptrend, price will often pull back to a prior resistance level (now acting as support), a moving average, or a Fibonacci retracement level (38.2% or 50%).
- Volume decreases on the pullback: In a genuine continuation pullback, trading volume tends to be lower during the correction than during the trend move.
- Momentum indicators remain positive: If RSI holds above 50 in an uptrend during the pullback, the underlying momentum has not reversed.
- Continuation candlestick patterns appear: Flags, pennants, and inside bars during the correction suggest continuation.
Signs of a Trend Reversal:
- When price makes a new high but RSI or MACD makes a lower high (bearish divergence), price is rising but the strength behind the move is weakening.
- Reversal candlestick patterns at key levels: An Evening Star, Dark Cloud Cover, or Engulfing pattern at a major resistance level after a long uptrend is a strong reversal signal.
- Break of trendline with volume: When price breaks through the uptrend trendline on high volume, it signals that sellers have overcome buyers with conviction.
- Failure to make a new high/low: In an uptrend, if price fails to make a new high and instead stalls at a lower level, it shows weakening buying pressure.
Key Takeaway: No single signal is definitive — always look for at least two confirming signs before concluding that a reversal is underway. Patience at this juncture separates profitable traders from those who are constantly stopped out.